SocialPeta and Nativex released a review of global mobile market data in 2020. The report titled “2020 White Paper on Media Buying in the Global Mobile Market” also makes predictions on the mobile market trends for 2021.

I. Game Apps: Significant Changes in the Pattern of Media Buying
In 2020, media buying in the global mobile market still maintained a strong momentum. The ratio of creatives on the game apps to non-game apps stands at 2:8.
The analysts estimate that over 350,000 mobile apps around the globe will join the competition in media buying in 2021.
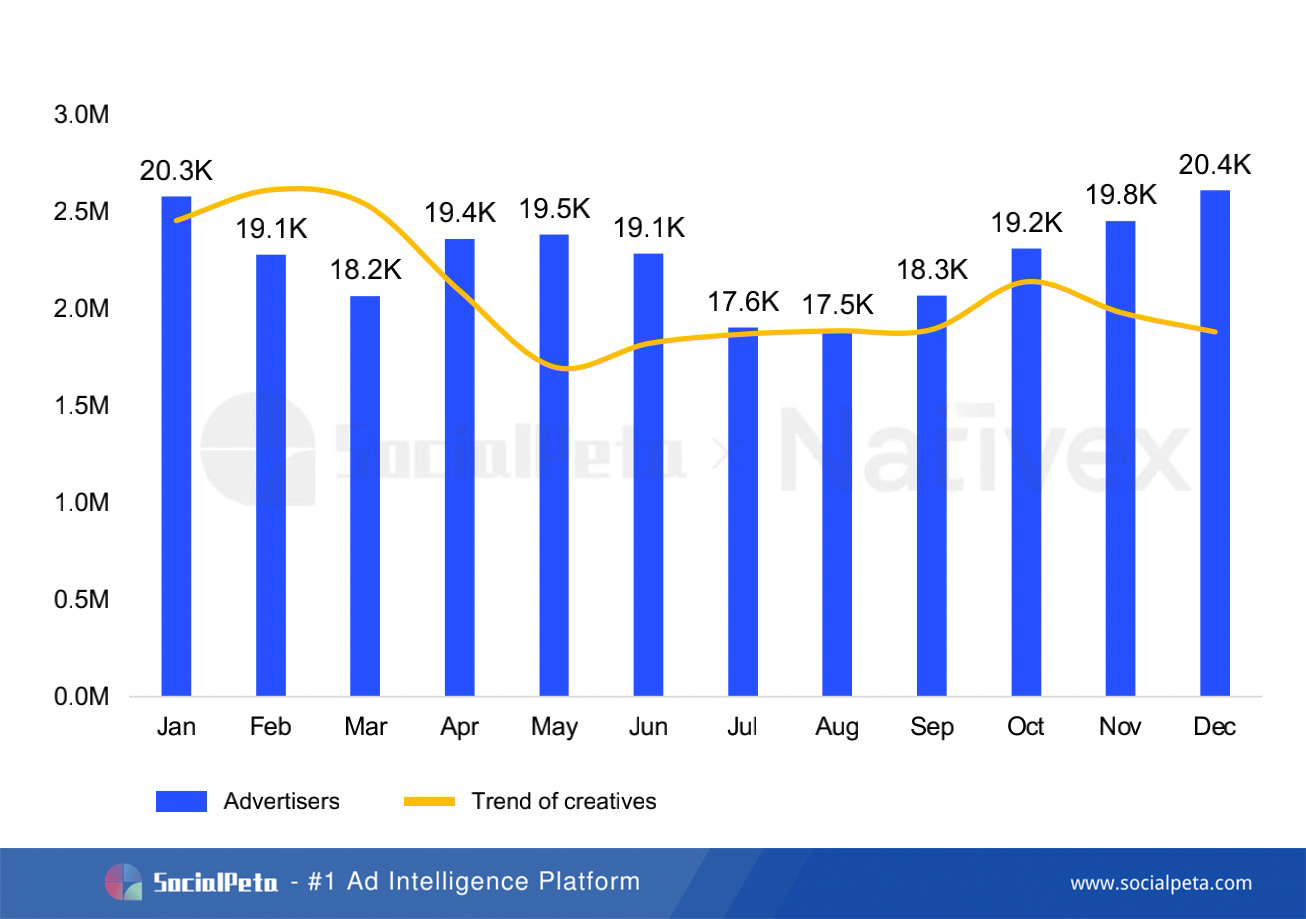
The trend of global advertisers in 2020
In terms of the media buying trend, the number of advertisers in 2020 increased by 7.8% compared to that in 2019. The most significant increase was in Q1, representing 32%; the number of advertisers peaked in January 2020, exceeding 20,000 cumulatively. After that, it declined with fluctuations until an increase in Q4. As for the amount of creatives, Q1 and Q4 were major periods of placement; in Q4, the ratio of Android advertisers to iOS advertisers was 6:4.
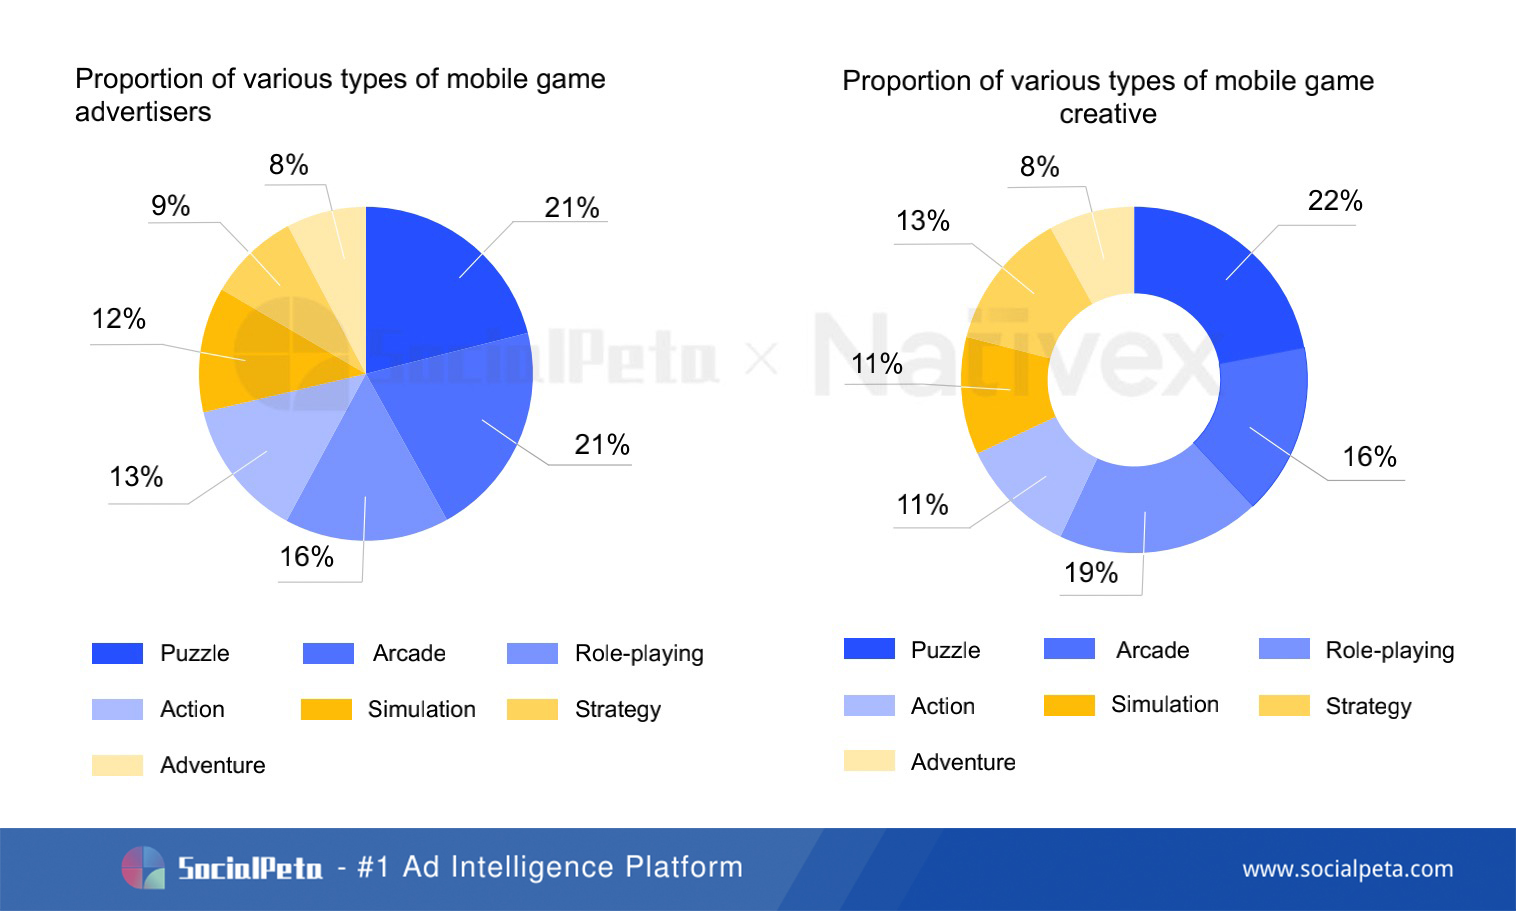
In terms of game types, the quantity of puzzle advertisers with creatives was the highest, cumulatively reaching nearly 11,000 and over 2.8 million respectively; strategy games were the largest media buyers, with each advertiser placing 359 pieces of creative annually on average; creatives of simulation games were the most popular with users, gaining the highest popularity.
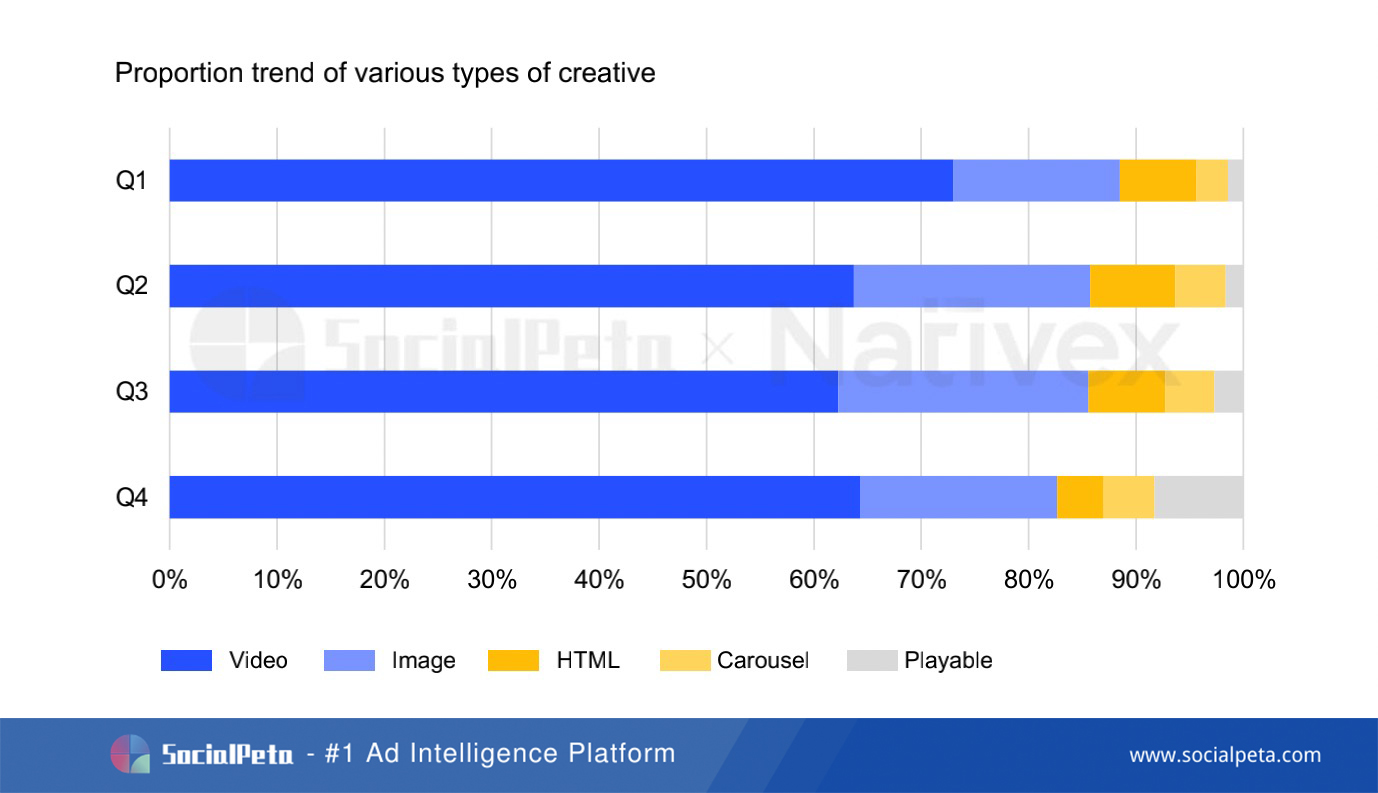
In terms of creatives, videos were still the first choice for advertisers, taking over 60% of all creatives, in which playable ads rose sharply and rapidly from less than 2% in early 2020 to nearly 8% in Q4. As for forms of creatives, screen recording, sitcoms, real person narration, MG animation, etc. were more popular; GamePlay was more suitable for casual games, and real person creatives were more commonly seen in midcore and hardcore games, such as RPG and SLG.
Among international channels, Facebook (FB News Feed, Audience Network, Instagram, Messenger) and Google (Google Ads, YouTube) were still the most popular.
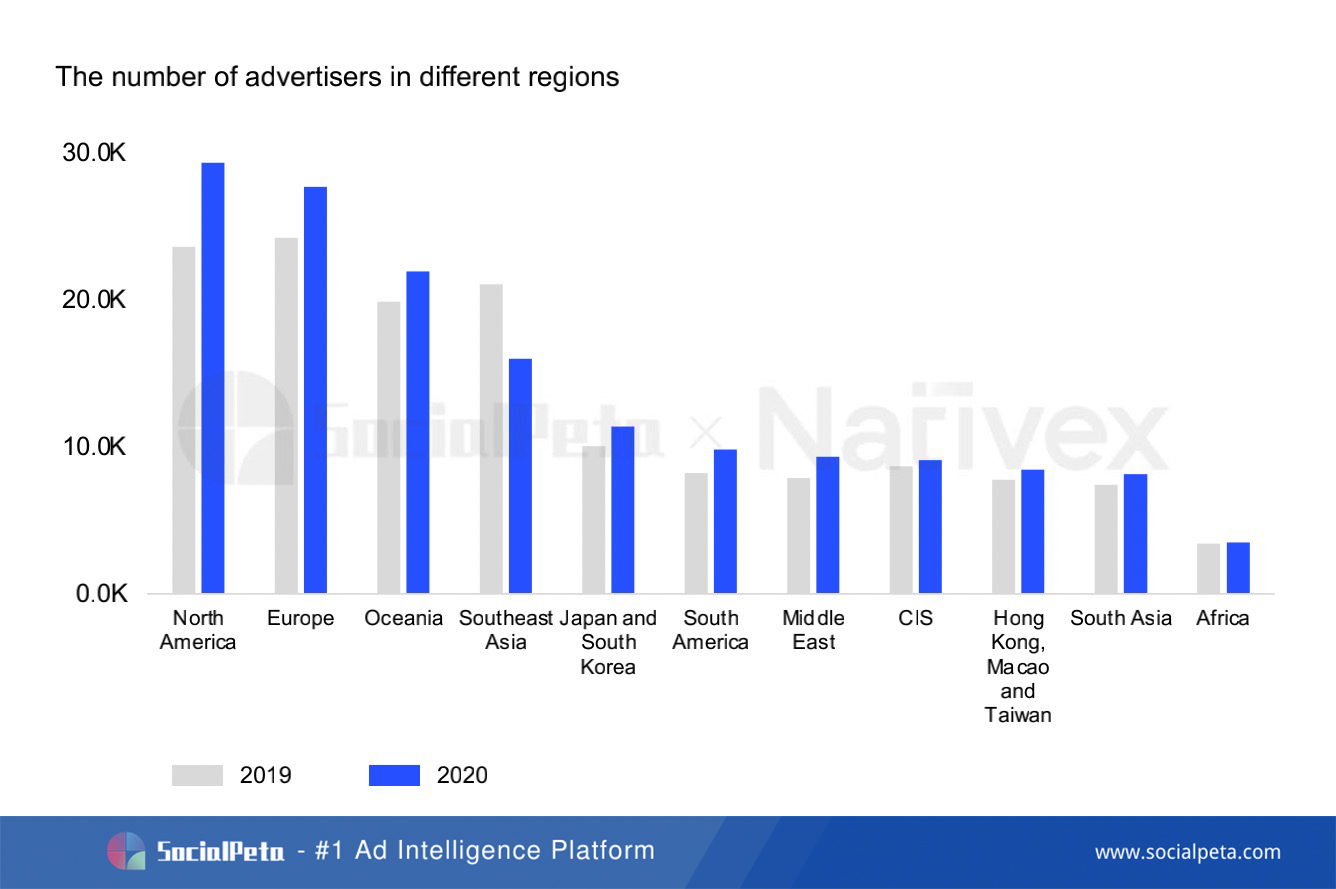
As for popular countries, advertising in the USA reached a small peak in April, and the number of advertisers in Japan and South Korea increased by 15.4% and 3.5% year-on-year respectively.
In the future, with the growing demand for content consumption, “Z Generation” will account for the most of the user base. Short videos and live streams are going viral with the stay-at-home economy. KOLs and livestreamer will be popular types of creative among advertisers; with the emergence of ‘SHEconomy’, female-oriented game market has higher potential to become a hit, and games combining leisure and practical science popularization have better prospects.
II. Non-game Apps: Impressive Short Video Market
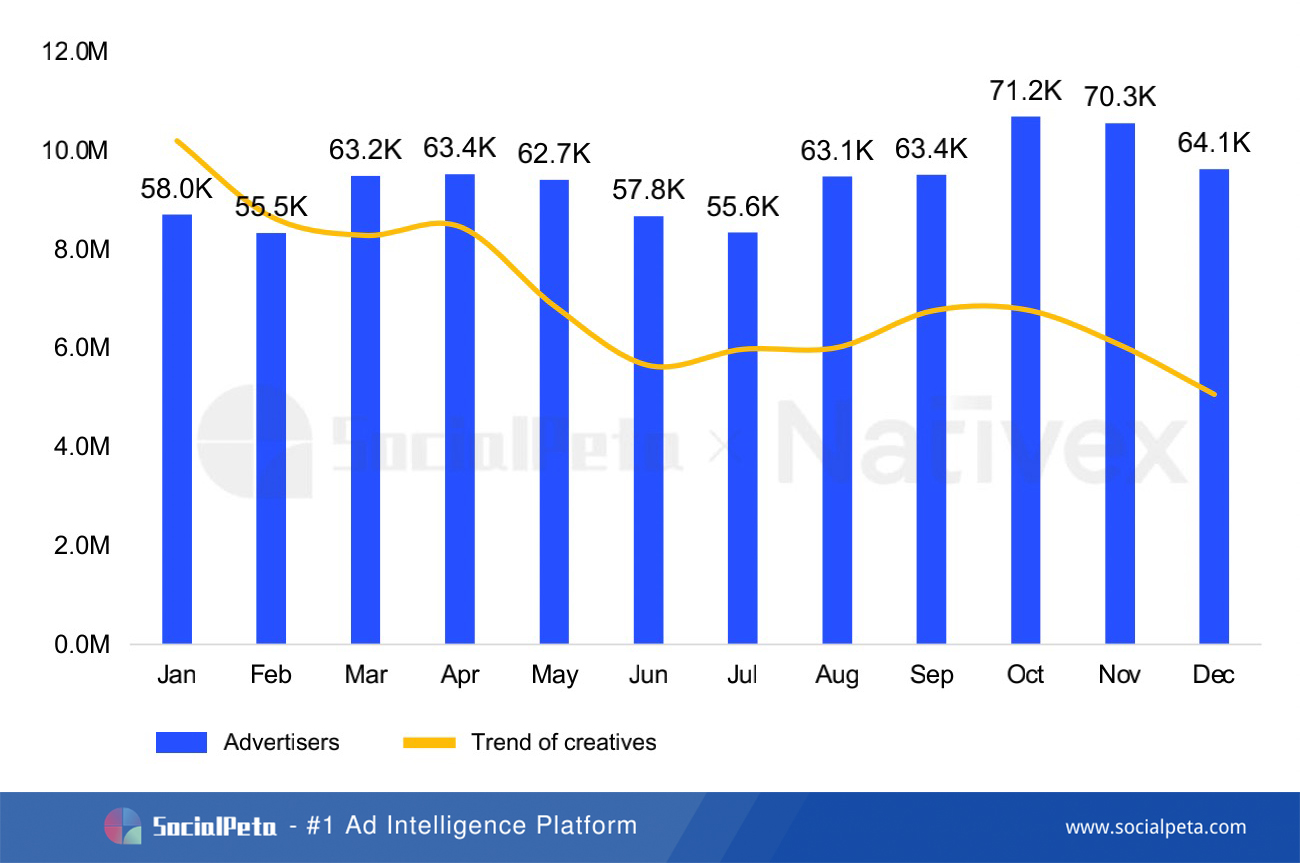
The trend of global non-game advertisers in 2020
While impacting the economy, COVID-19 also affected mobile advertising. The amount of creatives shows fluctuation in media buying of global mobile advertisers fluctuated in 2020, but the downturn was slightly reversed in September; it reached a small peak in April and October respectively.
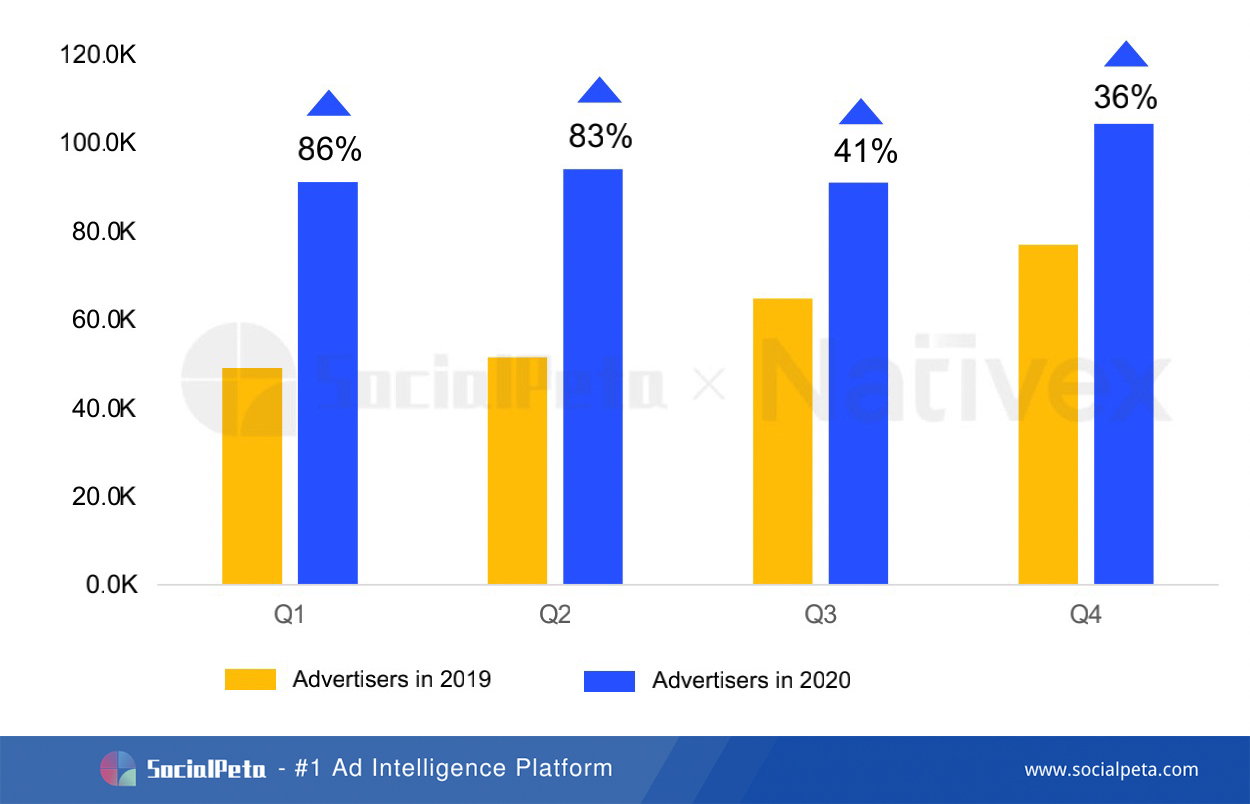
The changing trend of non-game advertisers from 2019 to 2020
As for the trend of advertising, the number of advertisers increased by 60.1% in 2020 compared with that in 2019, and the growth rate was obvious in H1, exceeding 80% in Q1 and Q2 year-over-year respectively. The proportion of Android advertisers kept rising, which was 62.44% in Q1 of 2020, and then rose again modestly. At present, the ratio of Android advertisers to iOS advertisers stands at nearly 6:4.
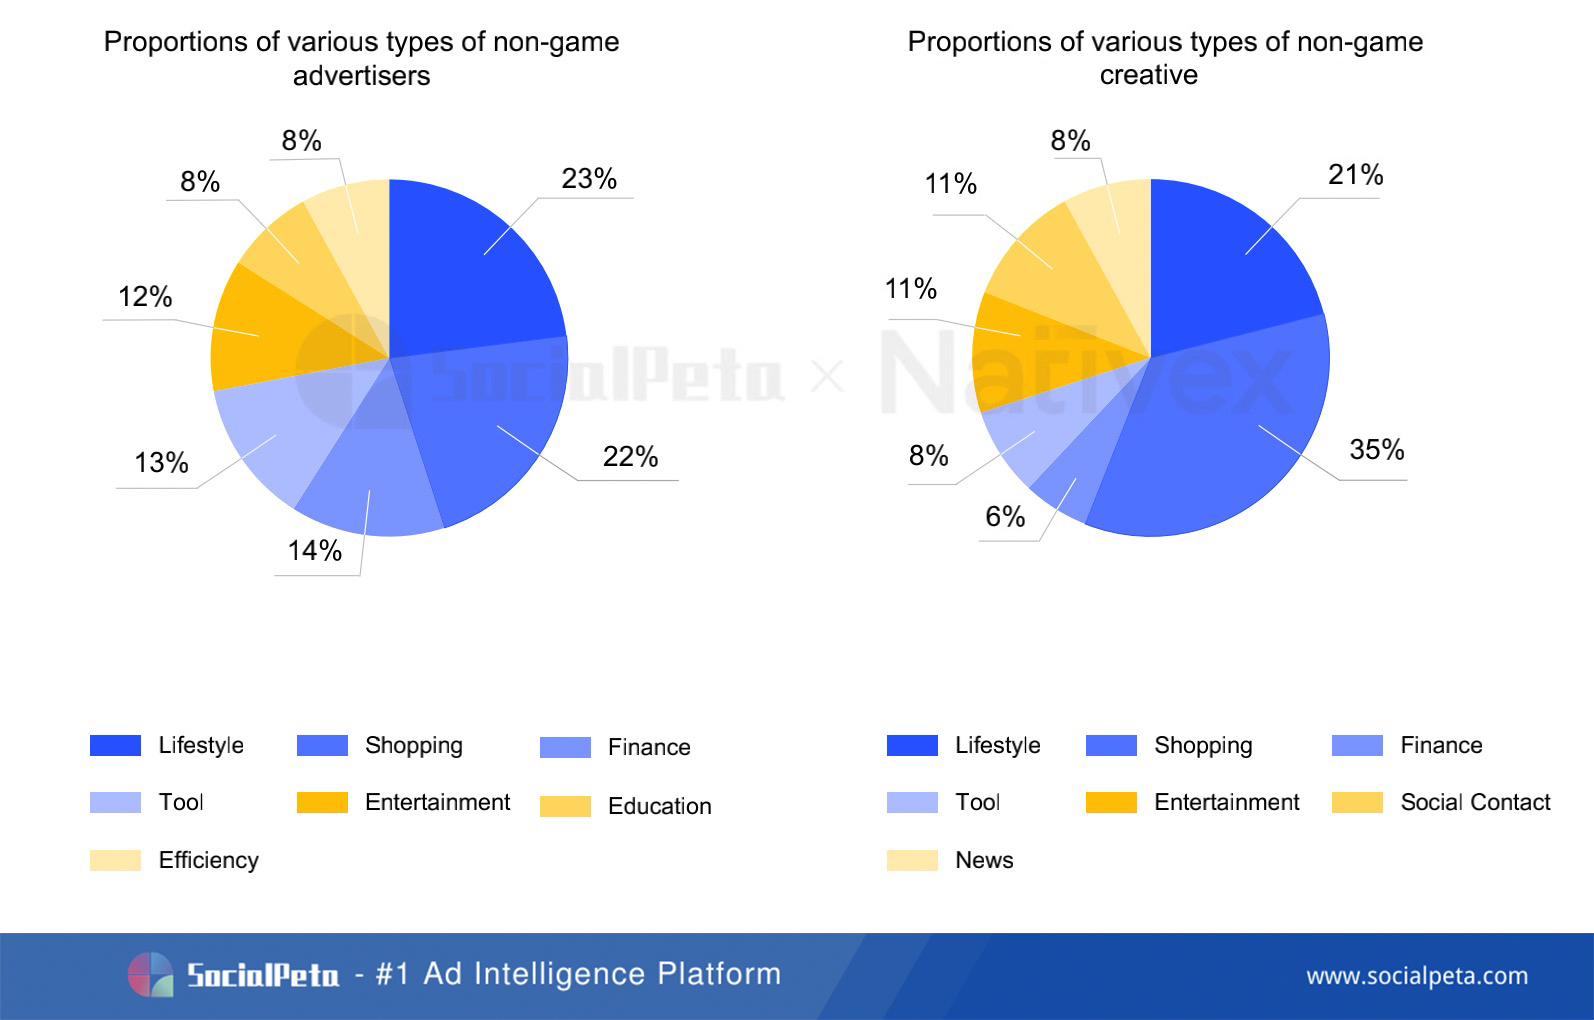
In terms of advertising types, life fashion advertisers took the largest proportion of 23%; shopping apps contributed the highest proportion of media buying, each placing over 200 pieces of creative annually on average; the creatives of tool apps were most popular among users, each piece gaining high popularity on average; UGC contents and convenient video editing tools also boosted the boom of short videos, showing great prospects.
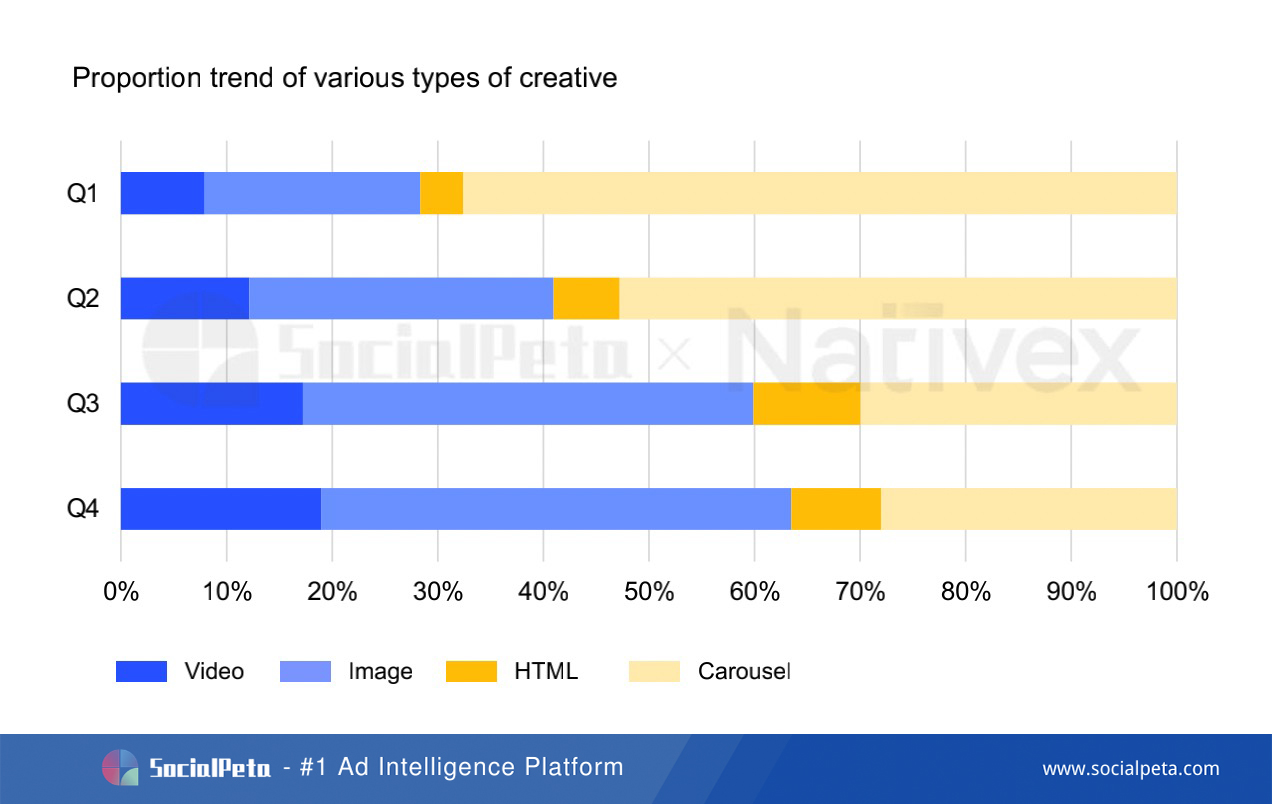
Among all types of creatives, static creatives such as images or carousels were preferred by non-game advertisers. The proportion of carousel creatives once exceeded 50% in Q1 and Q2; image creatives increased significantly to and took a share of 44.45% in Q4; video creative was not as absolutely advantageous as apps, but it kept increasing in 2020, and reached to nearly 19.2% in Q4.
Based on the data, Top 5 channels were FB News Feed, Instagram, Audience Network, Messenger, and Google Ads (Admob).
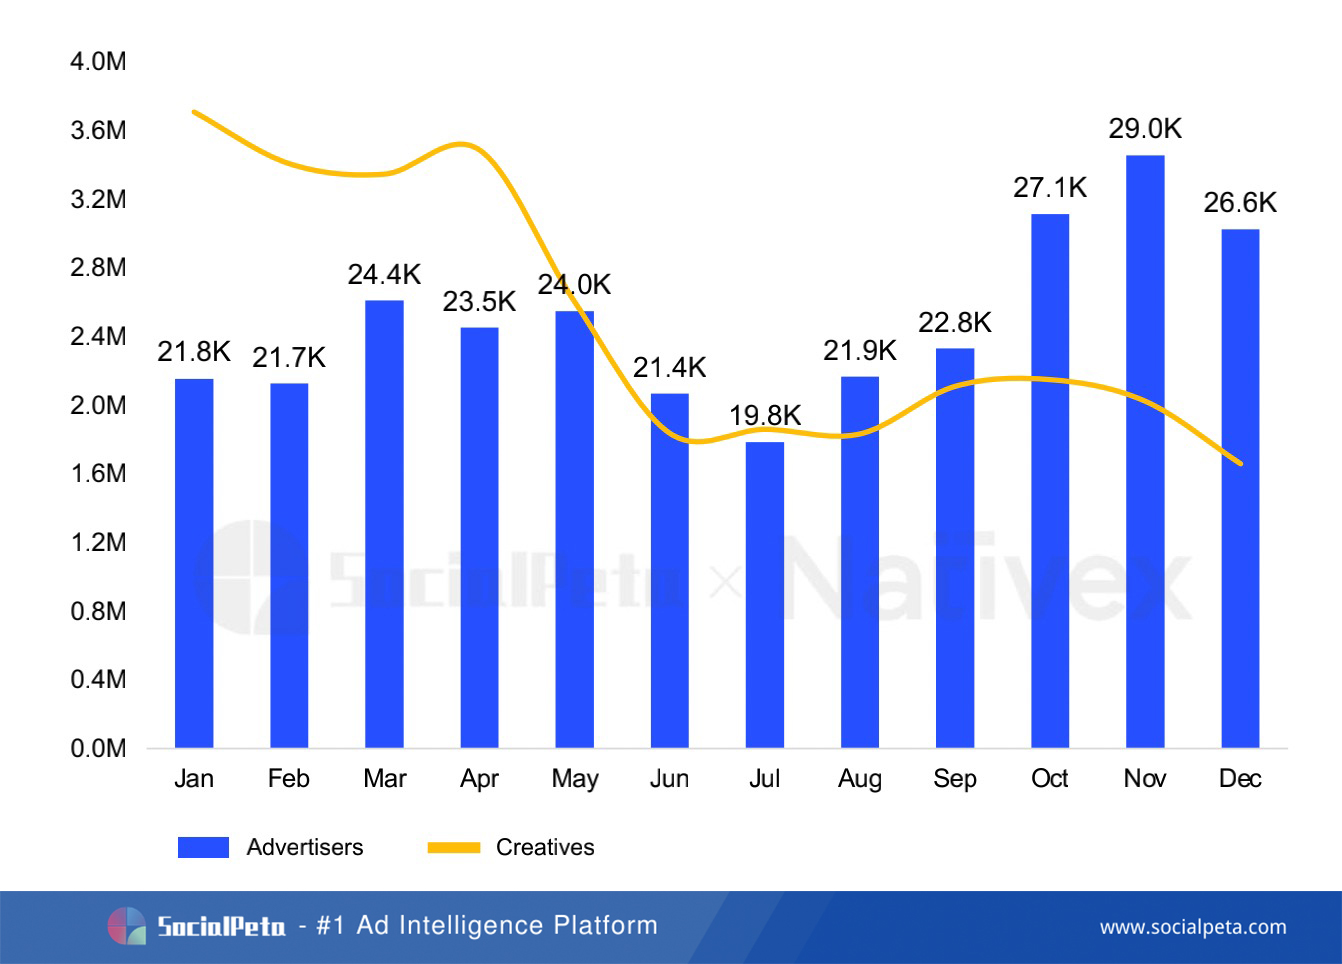
Popular Country – USA
In terms of hot regions, the highest number of advertisers in the USA appeared in November, reaching nearly 30,000 advertisers cumulatively; the number of advertisers in Japan and South Korea increased by 14.41% in 2020 year-on-year, and the amount of creatives rose by 14.03% year-on-year; life fashion, shopping and tool app advertisers ranked top 3 in Southeast Asia, maintaining around 9,000 advertisers monthly on average.
In the future, as advantages and a trend of studying, working, and getting life services on the mobile Internet were catalyzed in 2020, the online economy has broad prospects, and global video, entertainment, and consumption apps will keep booming; in a short term, the situation of “lockdown offline and accelerated integration online” will continue, with transnational travel apps weakening and the genres of international logistics and finance to explode.
***
SocialPeta is an advertising marketing analysis platform launched online in 2016. It covers 70+ global channels and provides multi-dimensional analysis of over 5 million advertisers and over 1 billion pieces of advertising creative data.
Nativex is a mobile marketing platform. Nativex provides a one-stop intelligent advertising platform XMP, and connects necessary media, KOLs and creative services, to achieve effective cross-channel advertising.
You can download “2020 White Paper on Media Buying in the Global Mobile Market” here.