The marketing company Soomla revealed how much Ad LTV varies depending on the region, the advertising network, the OS version, as well as the brand and model of the mobile device.
The Israeli startup unveiled the information as part of its Ad LTV Benchmarks Report. It analyzes data for Q4 2018. According to the introduction, the report focuses on hyper casual games. However, the main body of the report does not mention it.
Key findings
The report focuses on D7 Ad LTV. This metric represents the total revenue generated through advertising by an average user in seven days following the installation of an app.
The highest D7 Ad LTV is, expectably, in the US, where it reaches 60.4¢ on Android. Australia shows good results, with D7 Ad LTV reaching 37¢ both on Android and iOS.
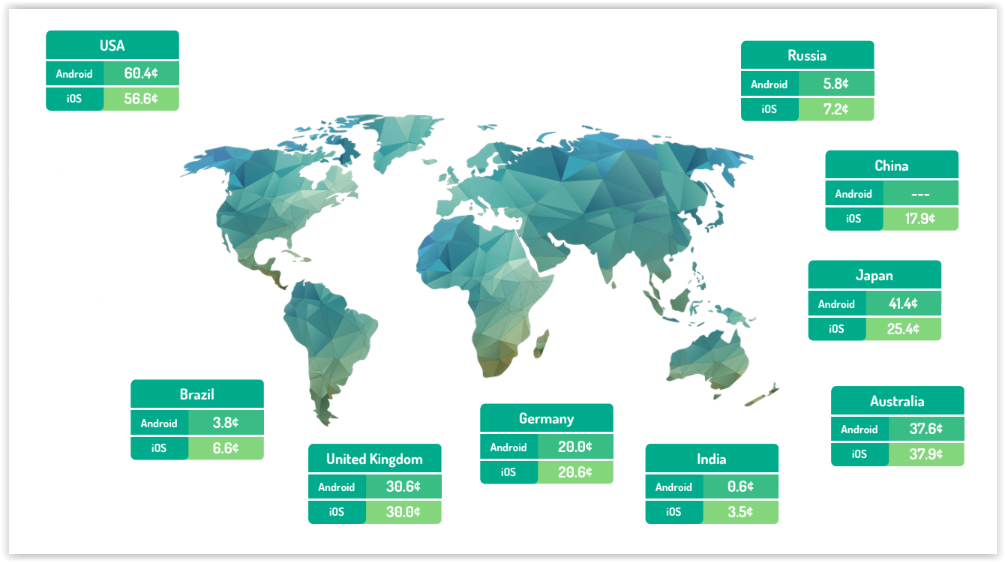
D7 LTV by country
How strong the app’s D7 LTV will be also depends on the traffic source. The US Android users coming from Vungle and Fyber show the highest results.
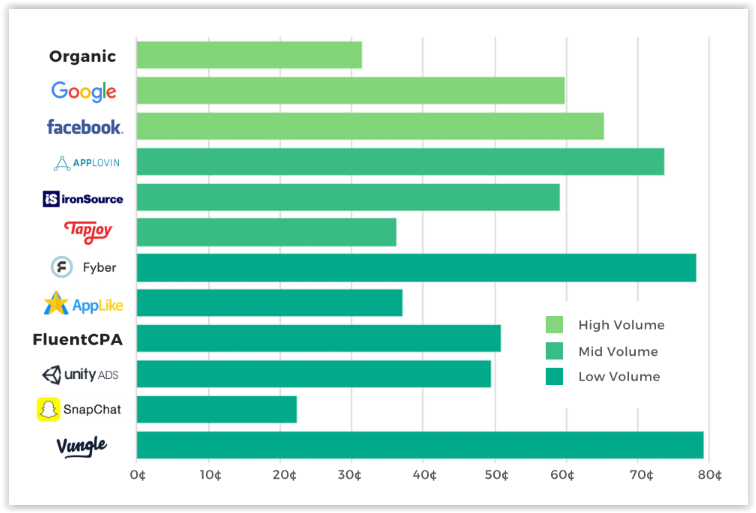
D7 LTV by traffic source (Android, US)
At the same time, on iOS, we see the highest D7 LTV for users coming from Google and Applovin.
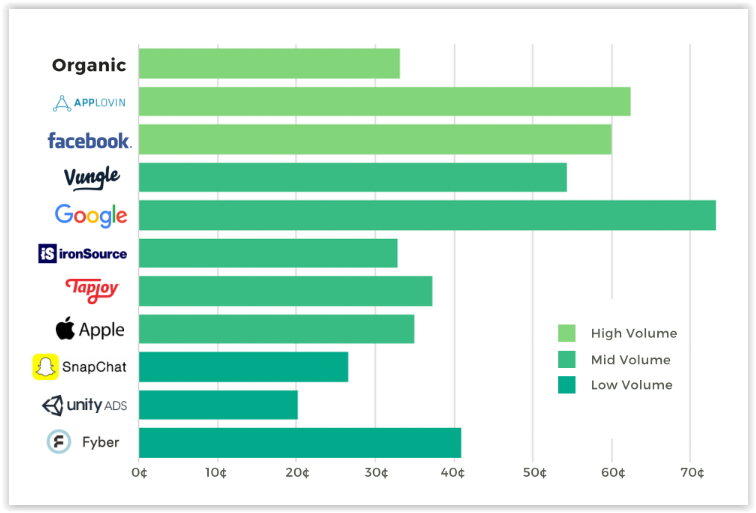
D7 LTV by traffic source (iOS, US)
D7 LTV varies significantly depending on the brand of the device. According to Soomla, Alcatel performs best among Android devices reaching 70¢+.
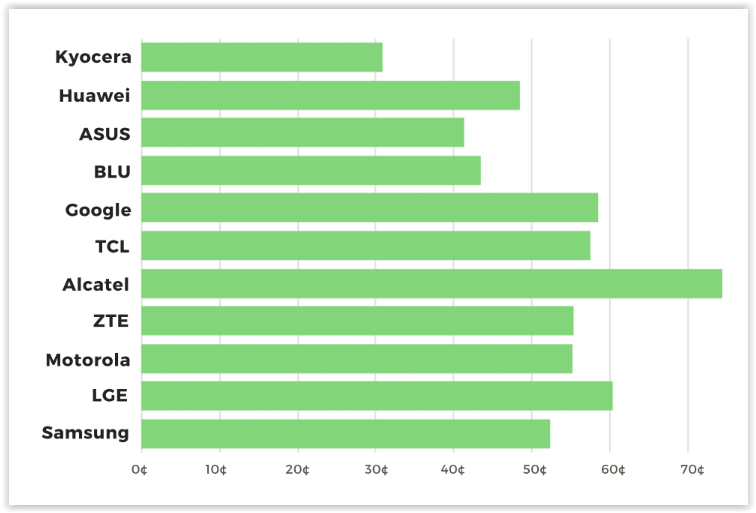
D7 LTV by manufacturer (Android, US)
The situation also depends on the model of the device. For example, Samsung SM-S327VL released three years ago shows a record 84¢ D7 Ad LTV. At the same time, last year’s SM-J337A model only shows 24.8¢. A similar D7 Ad LTV variance within one brand is seen on all Android devices, from LG to Motorola. Soomla, however, does not explain the reason for that.
There is also a strong dependence between D7 Ad LTV and the Android version. The newer the system, the bigger the revenue from advertising.
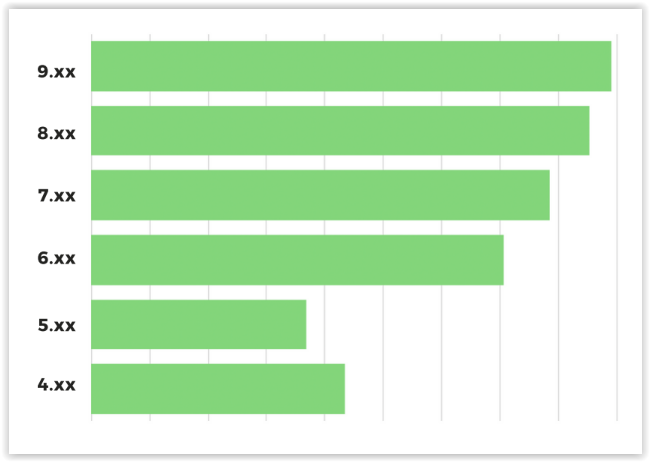
D7 LTV by OS version (Android, US)
The latter holds true for Apple devices. The highest D7 Ad LTV we see for devices updated to iOS 12.
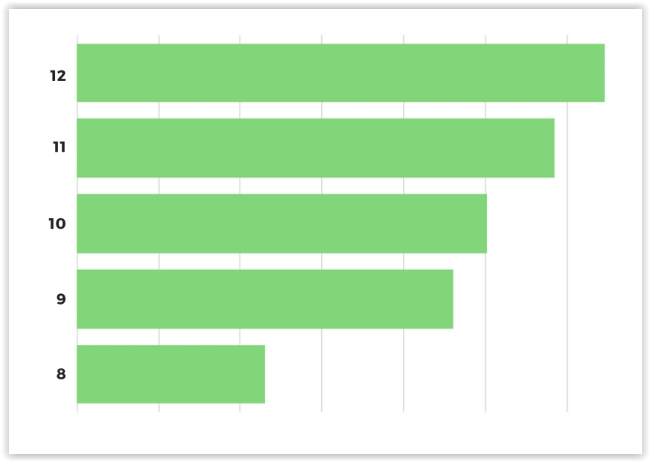
D7 LTV by OS version (iOS, US)
However, different iPhone models show smaller variance in D7 Ad LTV. In the United States, weekly advertising revenue on all devices averages around 55¢.
Research methodology
Soomla collected data worldwide from October to December 2018. A total of 10 billion impressions across 500+ appls contributed data. The study covered 150 million people.