So, you have released a mobile game. Do you know what to consider a good retention rate for your title? Wondering how much time users spend playing similar games? And what about money? How does your ARPPU compare to that of competitors?
GameAnalytics answers these questions in new Mobile Gaming Benchmarks report that was first presented at the White Nights Conference in St. Petersburg.

Key stats
- For top projects, Day 1 retention is 40% and higher;
- Trivia games show the highest Day 1 retention (up to 48%);
- Day 7 retention is good if it is 14%;
- Card games, Casinos, Trivia and Word games have the best Day 7 retention (20% or more);
- for top projects, the average Day 28 retention is 5-7%;
- Board games, Card games, Casinos, Puzzles and Word games have the highest Day 28 retention (10% or higher);
- for top games, the average session length (ASL) is 11-14 minutes;
- Card games and Casinos have the longest ASL (more than 25 minutes);
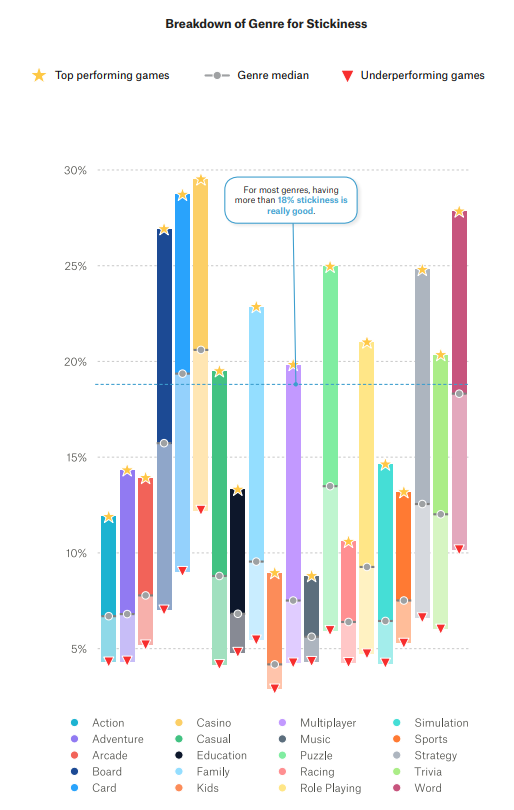
- stickiness of top projects is usually 18-20%;
- Board games, Card games, Casinos, Puzzles, and Word games are in the lead, with stickiness over 20%;
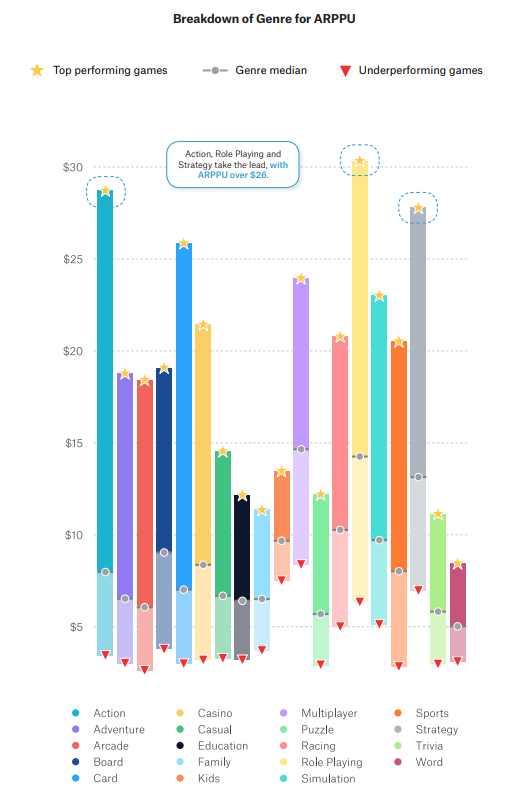
- in terms of ARPPU, market leaders gross $20-25;
- Action, Role Playing and Strategy games have the highest ARPPU;
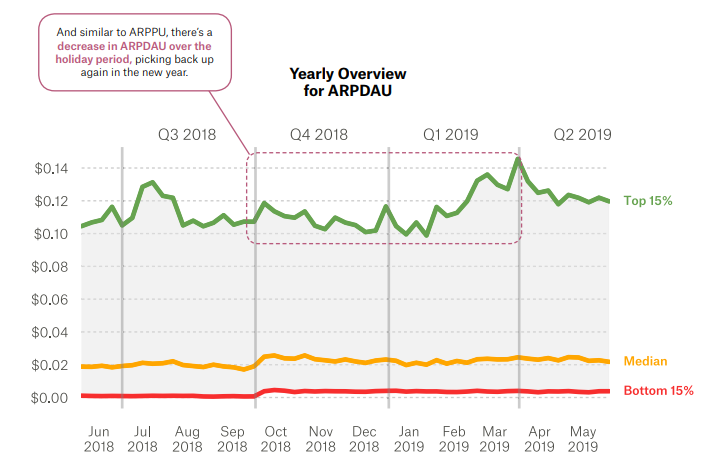
- ARPDAU for top projects is $0.10-0.14;
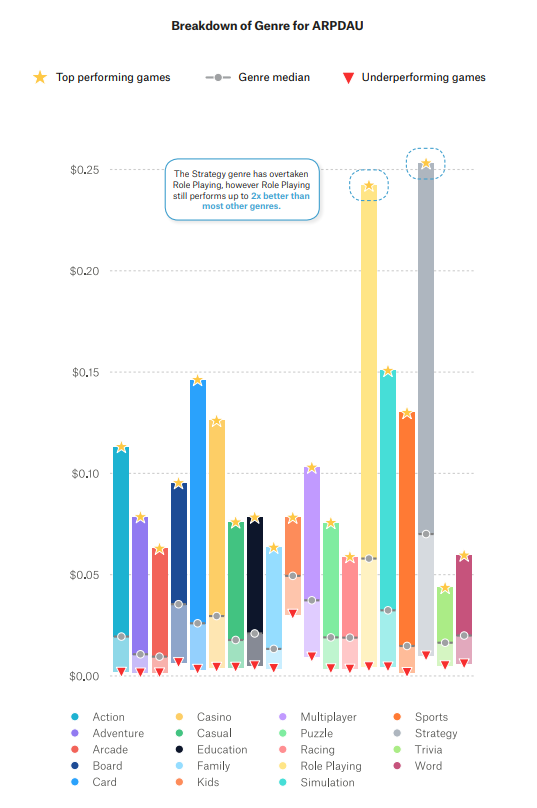
- the highest ARPDAU is observed in Role Playing games and Strategies;
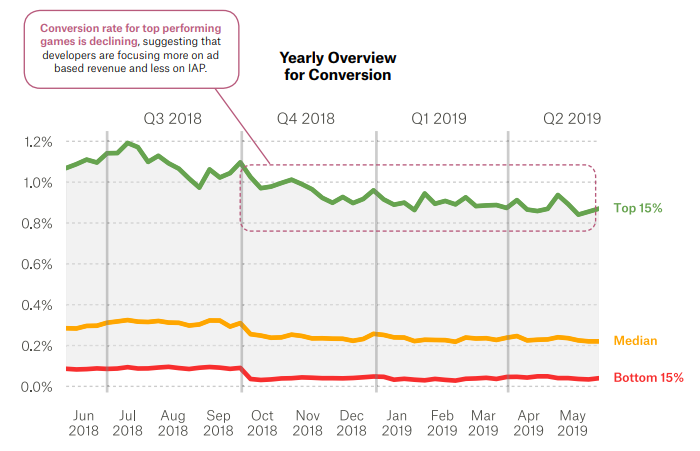
- for the top 15% of games, the conversion rate is 0.8-1.2%;
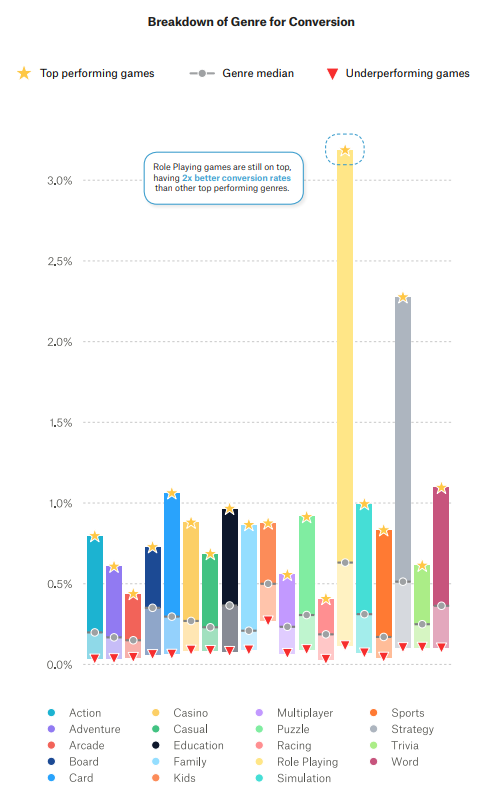
- Role Playing games and Strategies have the highest conversion rate (2-3%).
More detail below.
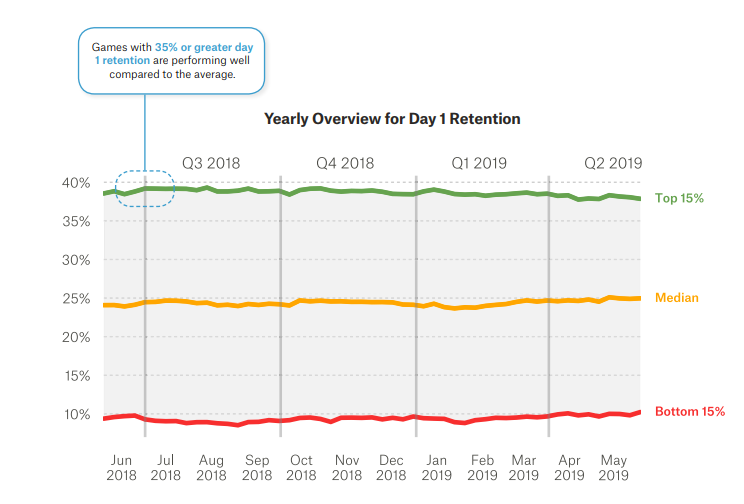
D1 retention
This metric reflects how many users return to the game after one day of playing.
D1 retention rate is considered excellent if it is 40% or more. Very few projects can boast D1 retention rate this high.
The median D1 retention rate is about 25%. However, GameAnalytics points out that many studios today permanently drop projects if their D1 retention is less than 35%.
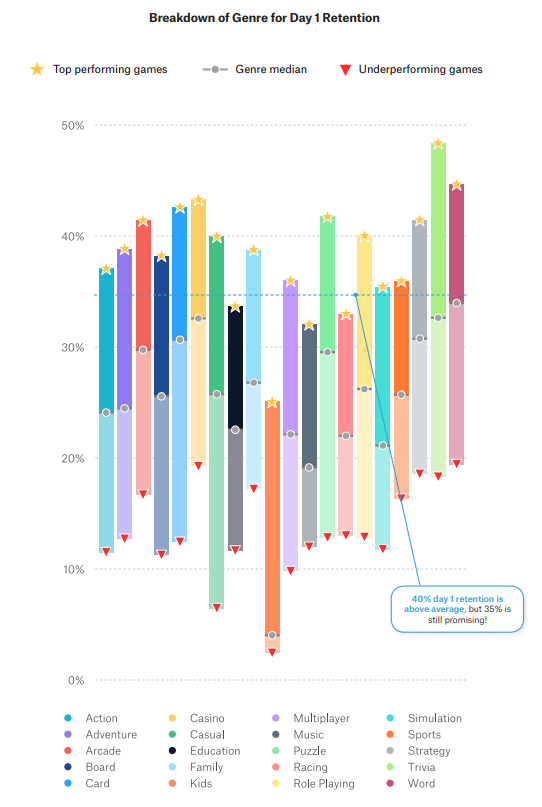
Within each genre, D1 retention rate varies greatly from project to project. However, on average, game for children have the toughest time retaining users. Even top performing titles in the Kids category can’t reach 25% D1 retention.
Trivia games take the lead, with best-performing titles reaching D1 retention of up to 48%.
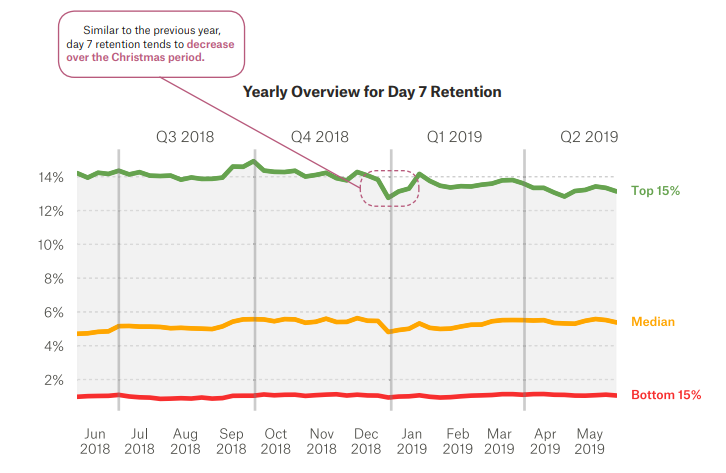
D7 retention
This metric reflects the percentage of users who keep returning to the game after a week of playing.
According to GameAnalytics, 14% is considered a good D7 retention rate across the market. Only the top 15% of games achieve this result.
The median D7 retention rate is 5%.
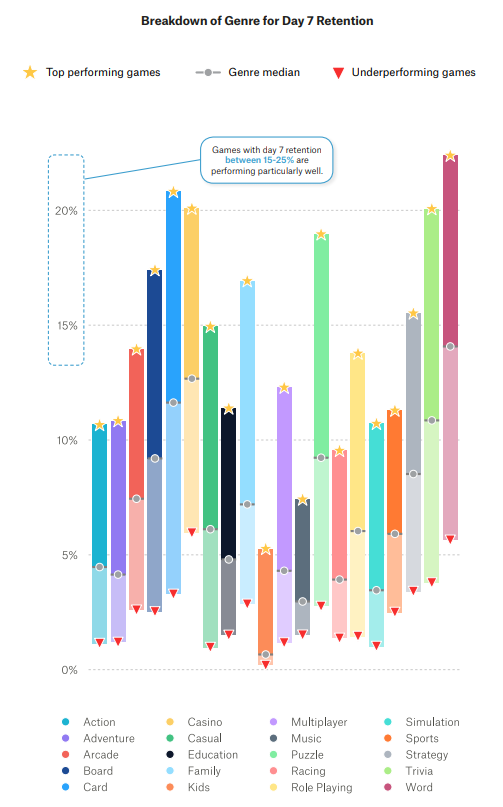
D7 retention between 15-25% is only reached by top projects of several genres. These include Board, Card games, Casino, Family games, Puzzles, Strategies, Trivia and Word games.
Across Racing, Music, and Kids categories, even the top performing titles do not reach 10% D7 retention.
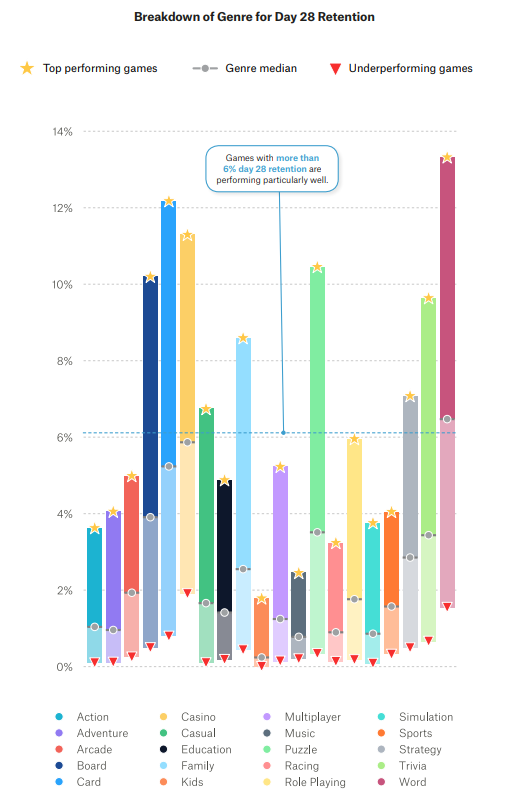
D28 retention
The metric looks at what percentage of users comes back to the game after a month of playing. And it’s low even for the best performing titles.
The top 15% typically see D28 retention reach 5-6%. As low as that this value is, it has been declining throughout 2019. Apparently, players begin to churn earlier than they did a year ago.
The median D28 retention is only 1-1.5%.
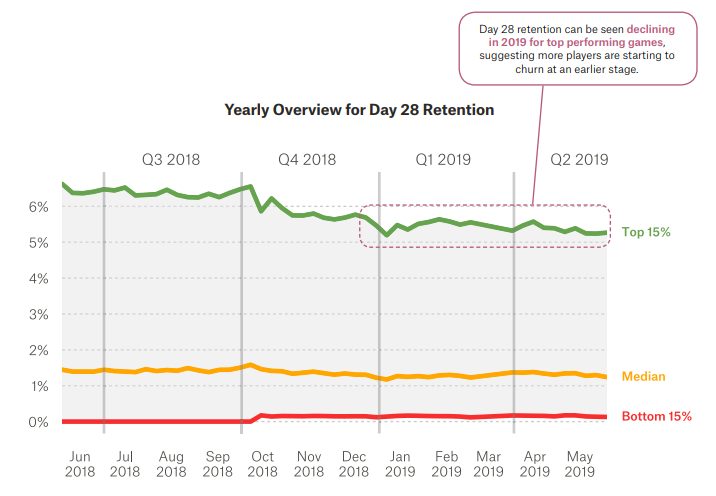
In most genres, top games will unlikely reach 10% D28 retention. However, hit titles in Board, Card, Casino, Puzzle, and Word categories can get past that mark.
Generally, GameAnalytics says that if your game is seeing D28 retention of 6% or more, you are doing just fine.
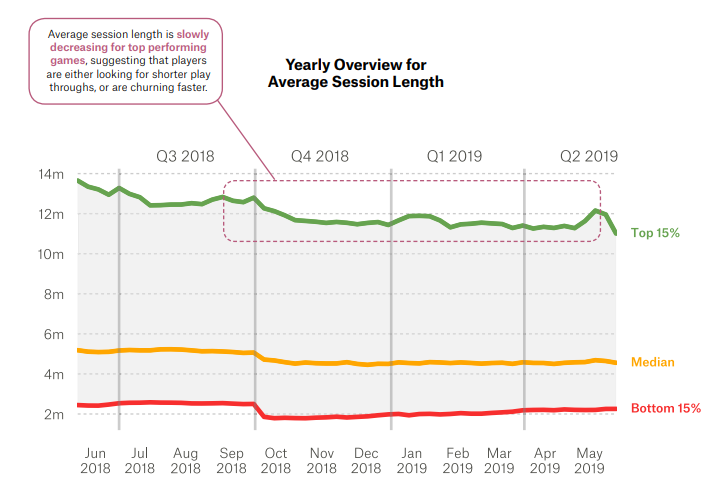
Average session length (ASL)
This metric measures the time users spend playing the game during a single session, from launching the app to closing it and sending it to the background.
Important: a short gaming session is not necessarily bad, while a long one is not necessarily good. But generally, given an equal set of conditions (genre, visual style, mechanics), the longer the ASL is, the more engaging your game is.
Only 15% of all games out there have the ASL lasting 11-12 minutes. And this have been dropping from month to month. Back in June 2018, this metric was about 14 minutes.
The median value of the average gaming session is 5-5.5 minutes. And it is also getting shorter.
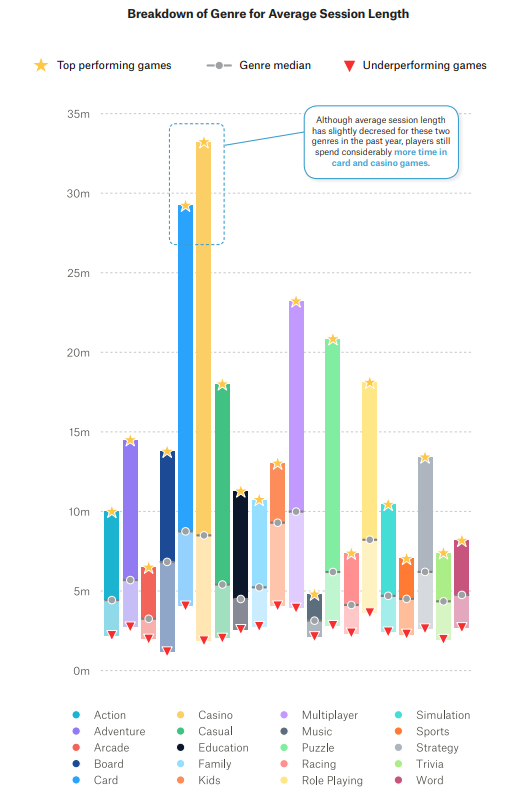
There are two genres that stand out in terms of ASL – Card games and Casinos. Users spend 25-35 minutes playing the top games in these categories.
Multiplayer games also perform quite well. In general, they have the longest median ASL among all genres – 10 minutes. The ASL of the top games in these genres is 22-23 minutes.
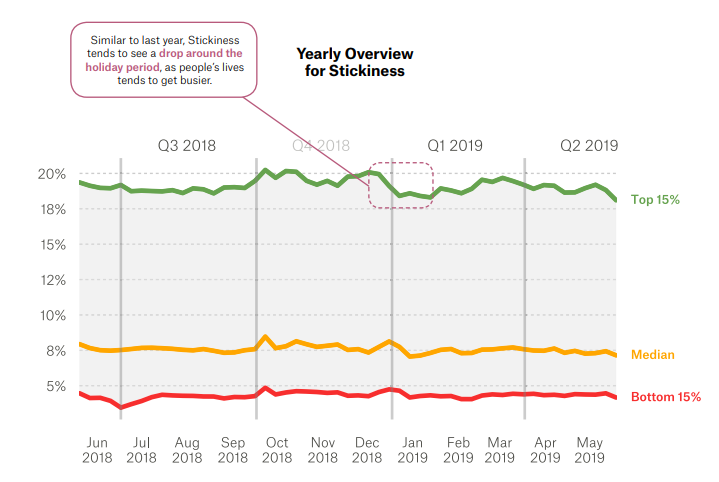
Stickiness
The metric represents the DAU-to-MAU ratio. It shows how many monthly users play each day.
The top 15% of games on the market have the stickiness of about 19%. GameAnalytics points out that if a game’s stickiness is at least 18%, this is a very good result.
The median stickiness across the market is about 8%.
Casino games show the best stickiness. The median value in this genre is above 20%. And the top Casino titles see their stickiness almost reach 30%.
Card games also perform very well, with stickiness ranging from 8% to 28%.
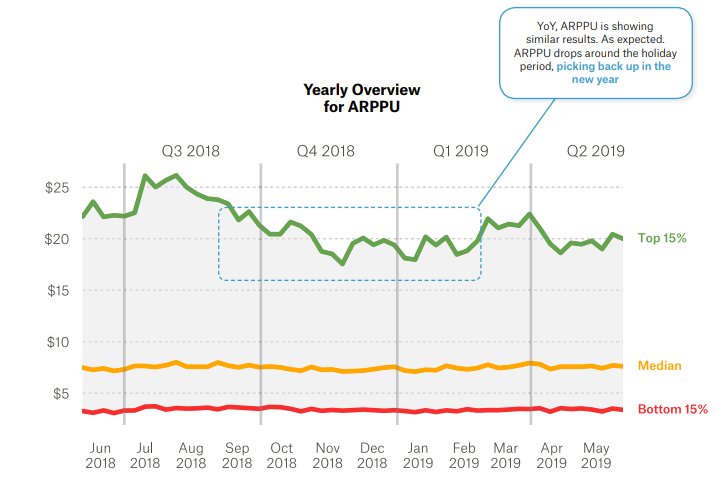
ARPPU
ARPPU stands for the average revenue per paying user. For the purposes of this study, GameAnalytics only considered direct payments made in game. Ad revenue was not taken into account.
For the top 15% of games, ARPPU is about $20. However, this metric in leading projects can fluctuate greatly depending on the season. It drops around Christmas and then gradually recovers throughout Q1-Q3. The explanation for this is that during holidays the paying audience increases. However, new users spend on average much less than the core player base does.
Action and Role Playing games have the biggest ARPPU ($27-31).
However, the best median value of $15 is seen in Multiplayer games.
ARPDAU
This metric reflects how much money developers make from a user in a single day.
In the top 15% of games, ARPDAU typically ranges from $0.10 to $0.14.
The median value is quite low – $0.02.
Strategies and Role Playing games show the highest ARPDAU, which can reach $0.25.
Card games and Simulators also see decent results of up to $0.15.
Conversion
This metric reflects the percentage of users making a purchase on a given day.
A year ago, the conversion rate for top titles reached 1.2%. As of May 2019, it has dropped to 0.8%. This is likely due to the fact developers increasingly monetize their games through ads.
In general, even top projects across the majority of genres rarely convert more than 1% of players. Two notable exceptions to this rule are Role Playing games with the 3% conversion rate and Strategies that can convert as many as 2.5% of players.
Methodology
The analysis looked at more than 75K games played by 3 billion users. The study covered the period from June 1, 2018, to May 31, 2019.